As I recovered from my car crash last year, I took up walking more. Each Sunday morning I would walk to church and, thanks to the calmer weekend traffic, I noticed all sorts of details around my neighborhood that I never paid attention to before. But after several weeks of this, I felt a deep awareness of how empty my city can be.
My route from Columbus’ Lakebottom Park to downtown makes for a lonely journey. You can walk it many times before you cross paths with another human being, and the chances that you even see another person from a distance is probably fifty-fifty.
You might see an athlete zip past as they cycle or jog on our Dragonfly Trail. But most of the time, if you see anyone in public at all, you see people who don’t have anywhere else to go. They don’t dress fashionably and don’t smile when they pass you. Many of them talk to themselves while they walk. They’re almost all male and at least middle-aged. I probably look like I fit right in. Even if I didn’t, it’s not like anyone else is around to notice.


My route is walkable in every technical sense. It has multiple sidewalks for its entire length, and even the aforementioned multi-use path for part of it. But it would be a stretch to call it comfortable, friendly, or possibly even safe. It feels less like walking and more like hiking.
(For the record, I’ve never felt unsafe on this route, but I likely owe that to my background and demographic. A parent would probably get a visit from the state if they were caught letting their child walk here unsupervised.)
As lonely as these walks can be, part of me enjoys them. Before I settled down in the “big city” of Columbus, I spent much of my young life in the great outdoors. I feel comfortable with solitude, and I like being alone with my thoughts.
But this whole situation feels wrong. It’s like walking through a forest that should be teeming with animals but you can’t hear a single chirp of birdsong. Even if you don’t know why the birds vanished, their silence betrays the ecosystem’s collapse. It’s hard not to wonder why one of Georgia’s most populous cities is so eerily quiet. Why can you cross neighborhood after neighborhood and only see empty front yards, empty sidewalks, and empty storefronts?
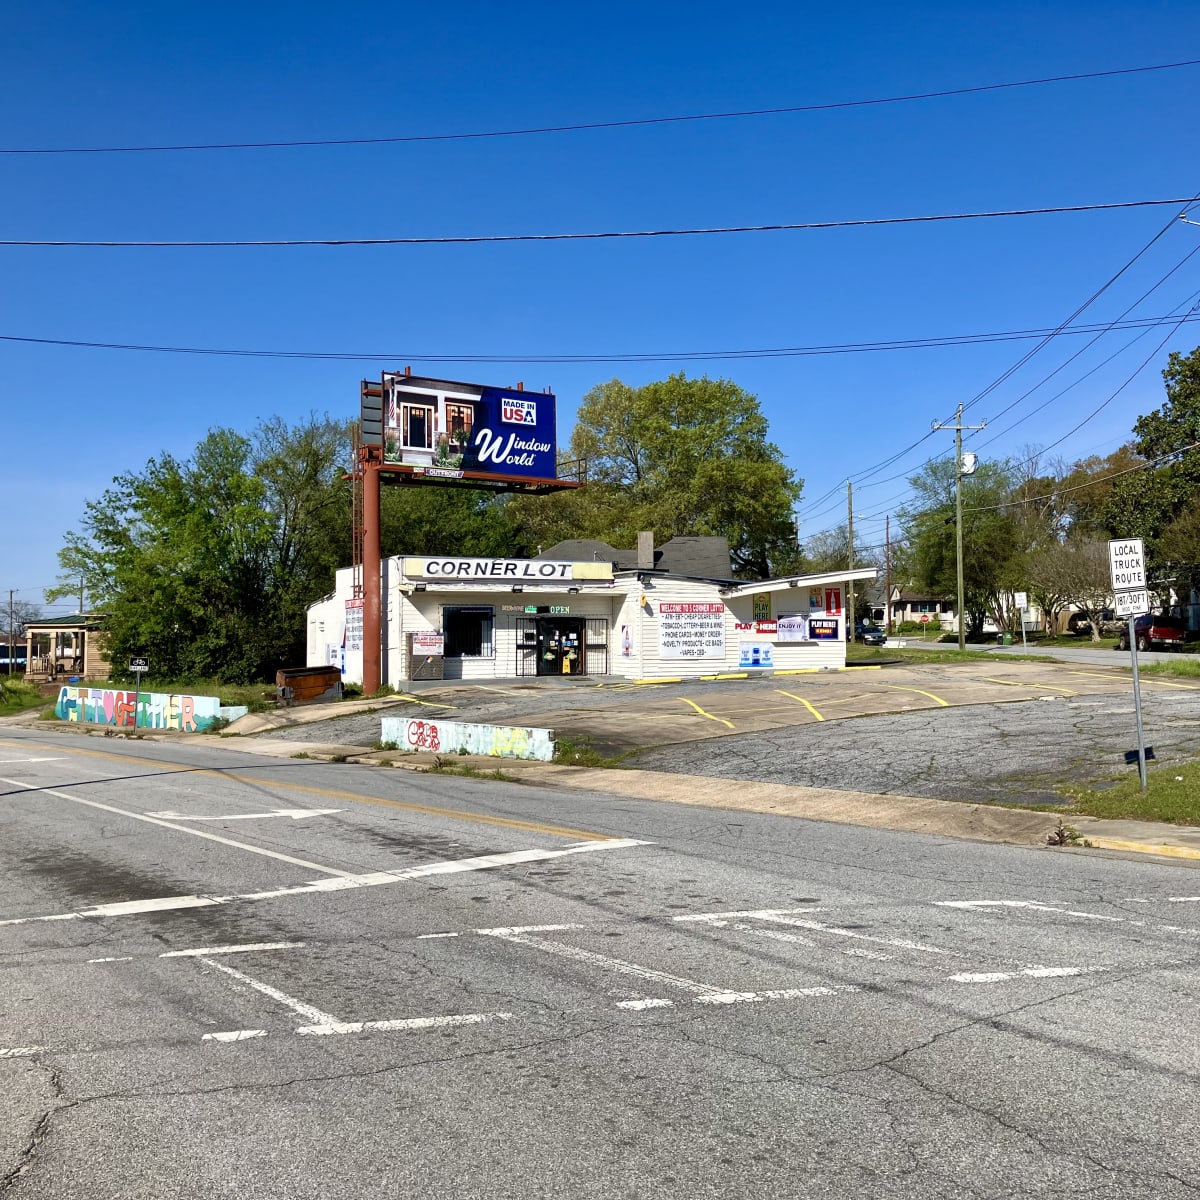

Even if everyone is just enjoying themselves indoors, the population on this stretch is especially thin. After I pass through the park district, commercial buildings mainly line the streets. These aren’t businesses that invite socializing, but rather they’re storage units and auto shops. Many of the buildings are vacant. There are a few newer restaurants and antique stores that do well in a revitalized section, but they’re like isolated islands in the emptiness, and they’re purely commercial. When business hours are over, the parking lots empty and people vanish.
And there’s a lot of blight. So much architecture along my walk consists of rotting buildings that have been empty for decades. They’ve persisted that way across many administrations and as other businesses have come and gone.
It again evokes an spooky sense that something is deeply wrong. My neighborhood, a few blocks away, is vibrant and thriving with people. The downtown area, a few blocks in the other direction, is experiencing a renaissance of new businesses and housing. Why is the area between the two so desolate? Shouldn’t it be prime real estate?


When the North American suburban experiment kicked off a couple of generations ago, new development accelerated in urban outskirts, sucking resources from the city centers. As a result, historic towns became hollowed-out, full of empty roads and crumbling buildings. The new parts of the cities, patchworks of strip malls, subdivisions, and interstates, surrounded the centers like a donut.
Southern cities saw most of their growth during this era, and they especially bought into this experimental development pattern. Columbus followed suit. A few decades later, we’re living in its natural end-result.
Some of the damage is reversing now, and I don’t want to shortchange the progress that people in my city are making. The restaurants and stores I mentioned earlier have breathed new life into the old buildings they inhabit. Piece by piece, these blighted blocks are transforming into something friendly and productive.
But today, on a beautiful Sunday morning, on this walkable route, this part of the city is empty. Maybe everyone is at home with their screens or out shopping in the strip malls, but they’re not here.

During my last walk, I passed two men on bicycles swerving in and out of the lanes. They were not cyclists; they wore street clothes with no helmets, and their seat posts looked uncomfortably low. They each balanced a cardboard box on their handlebars. One of them looked at me and shouted a question I didn’t catch, but he made a “lighter” gesture with his thumb. I said I don’t smoke, and the two kept cruising past down the hill.