
Georgia Bikes launches a new crash data dashboard
Advocacy organization Georgia Bikes has launched a dashboard to explore bicycle and pedestrian crash data in the Peach State. It is freely available for the public to use on their website.
“Crashes and fatalities involving vulnerable road users (VRUs) are on the rise in recent years for several reasons, including distracted driving, increased vehicle size and speed, and poor road design that prioritizes speed over safety,” said Georgia Bikes in their announcement. “In order to help you understand bike and pedestrian crash trends in your community, Georgia Bikes has developed a new interactive data dashboard.”
You can view the Georgia Bikes crash data dashboard here.
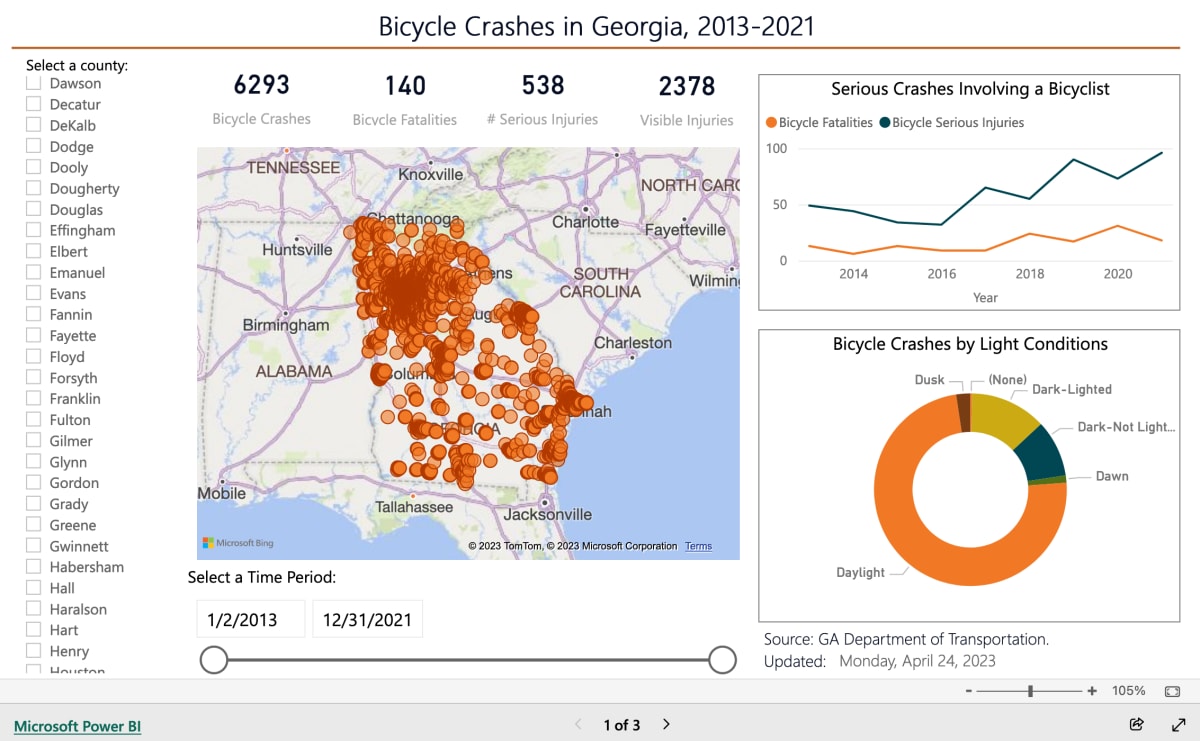
The dashboard uses data from 2013 to 2021, which is the most recent year available. It displays geographic locations of each crash, whether there was a fatality or an injury, and the light conditions at the time of the crash. Users can filter the data by county, switch between bicycle and pedestrian data, and view a year-to-date summary.
On the state level, this reveals that Georgia is roughly following the national trend of rising crashes. Additionally, the majority of crashes happen in the daylight, not at night. (74% of bicycle crashes and 52% of pedestrian crashes are in daylight.) Individual counties can differ, though, so this tool can help anyone who needs to view the exact data in their local area, or identify specific roads that are more dangerous.
This launch comes just after the NHTSA released their data showing that nationwide bicycle and pedestrian fatalities have hit a 40-year high. It’s a grim reality that we have so much crash data that we need more sophisticated tools to analyze it, but hopefully dashboards like this can help empower us to make our streets safer for everyone.